Improving the performance of your Rails app
Problem
When I started working on a new project I was faced with a challenge: figuring out what was causing app load times to be so long. The problem was overwhelming to me because it could be caused by a lot of different factors. I followed these three steps to keep me on track:
- Find out what the main problem was
- Understand it / Learn how to fix it
- Fix it
In the next sections, I'll be describing what I did in each of the above steps.
Finding out what the main problem was
To find out the main problem, I started by looking at the Google Chrome DevTools, specifically the Network section. I went through a few requests and observed the timing section for each request. This is where I started noticing that the longest time for the main requests (the requests for the most important pages) was, in all cases, spent just waiting for the server response (we can see this in the Request/Response section, under Waiting TTFB)
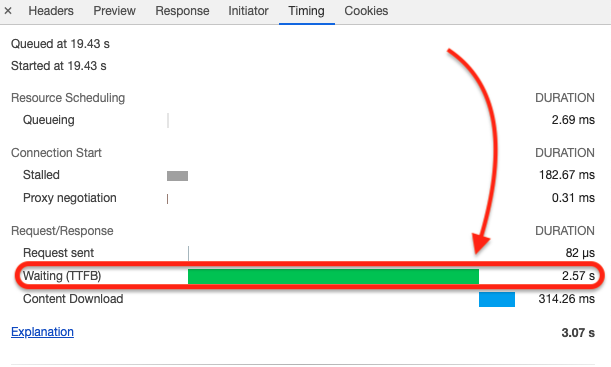
TTFB stands for Time to first byte. TTFB is impacted by three key actions:
- Sending a request from a client to the server
- Processing that request on the server and generating a response
- Sending the response from the server to the client
Since actions 1 and 3 consist mainly of network speeds / DNS lookups / the distance to the server and we don't have much control over those factors I decided to taker a deeper look at action 2. However, because that part is related to the server processing and generation of the response for the client, Chrome can't give us any information about what is going on when processing a request from a client. To do that we needed another tool.
Understanding it / Learning how to fix it
After searching for a tool I came across a Rails gem called Rack Mini Profiler, which is great and free. There are also paid services for analyzing server performance, like AppSignal.
Installing and using Rack Mini Profiler in a dev environment is as easy as installing any other Rails gem. To use it in productions environments it requires a few lines to configure it, but it is pretty straightforward. There is information on how to enable it on their Github readme doc.
Rack Mini Profiler
After installing the gem and starting up the project, if everything worked out fine, we should be able to see a little badge in the up left-hand corner of the page, it indicates the sum of times for all requests that the browser sent to the server, followed by the amount of requests, the format is (time ms x #request)
To open the full report for a specific request we need to click the badge, then select the request that we want to take a deeper look at (the request that took the longest to load, for example), click the share link:
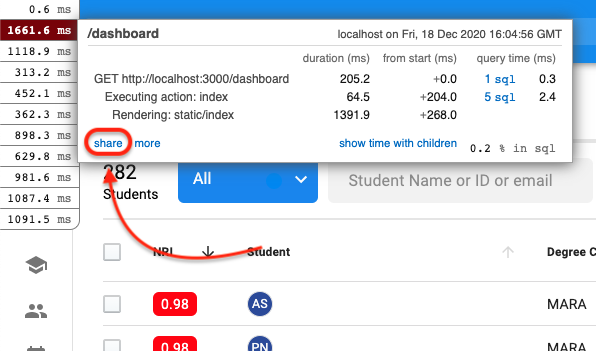
Once the full report for a request is open we can see the number of queries being performed by the backend server, we can also see the percentage of time taken by SQL resolution.
Sometimes we get reports like this:
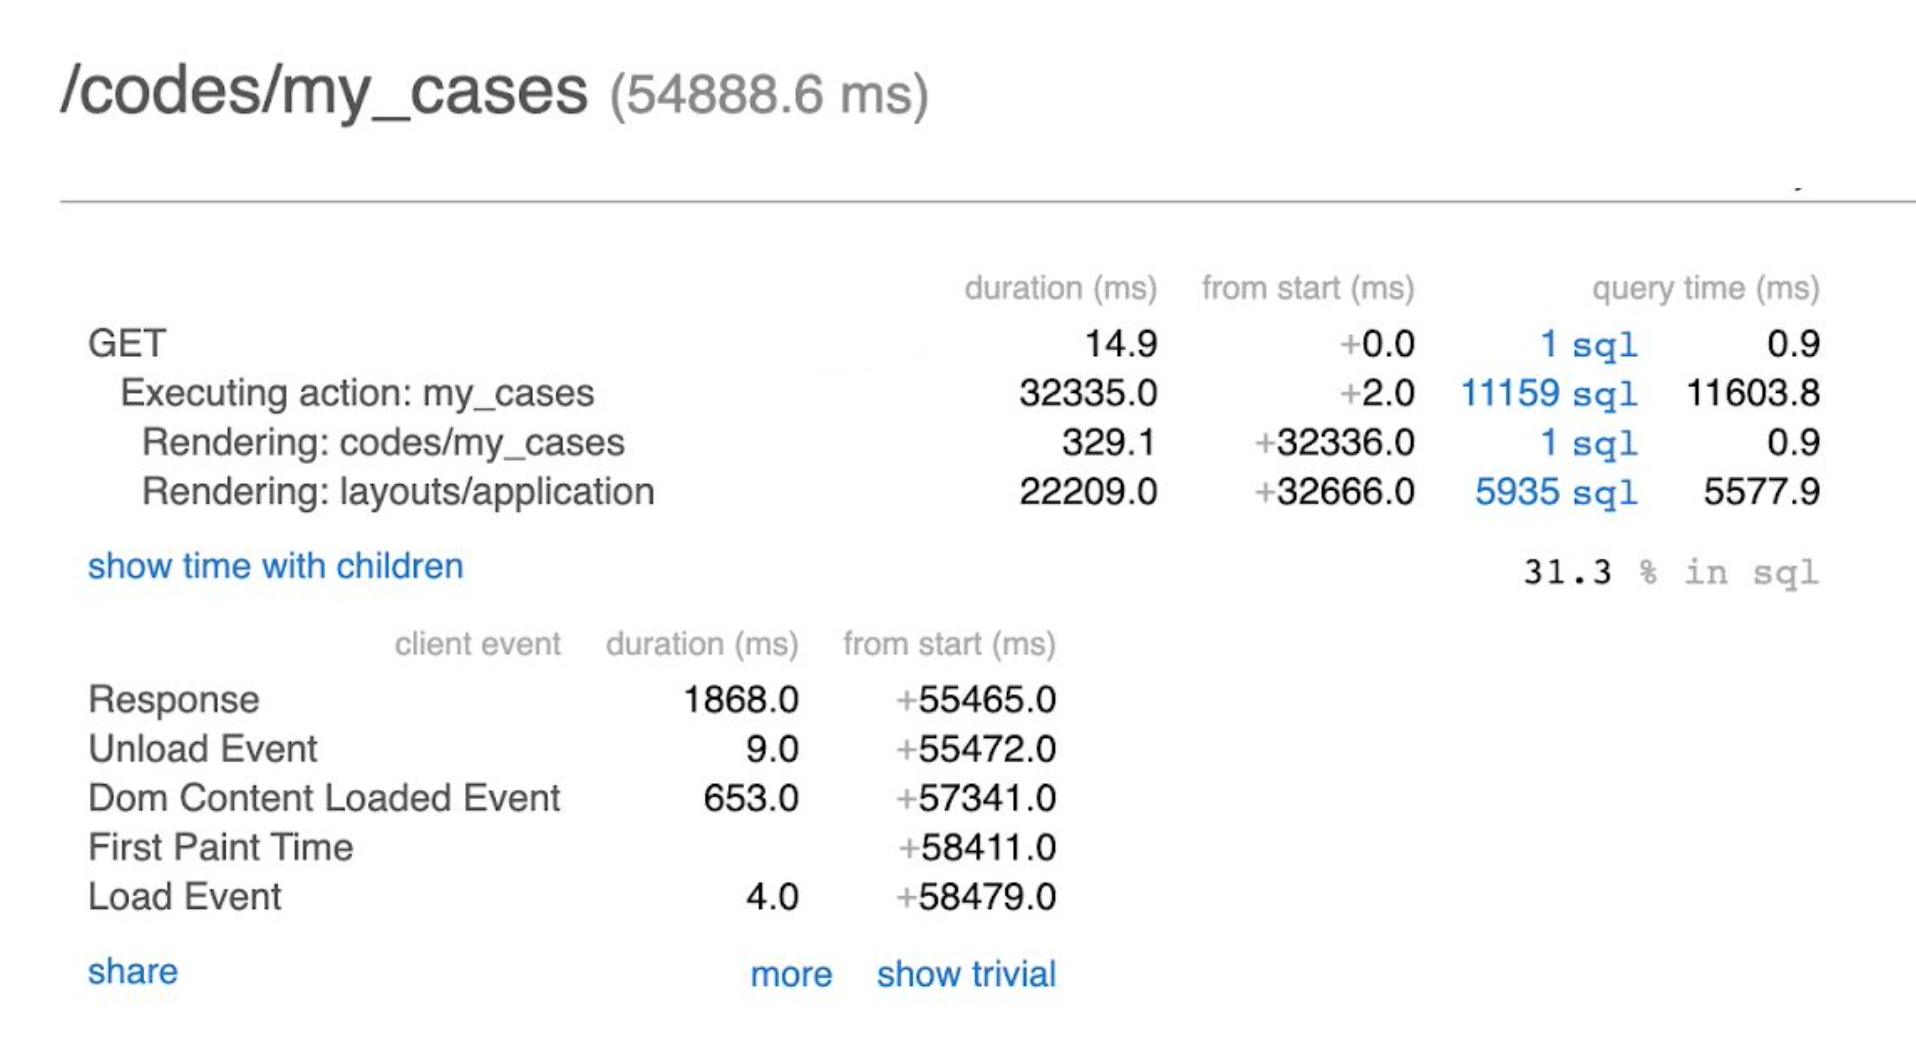
Here we can see an example of a profiling where a lot of time is spent in SQL. Also, for this specific example, we can see that there is an excessive amount of queries being sent to the DB.
Loading times are conditioned by the interaction that the app has with the DB, for this exact reason the amount of queries and how well they are made has a huge impact on the total time.
Identifying the queries that are taking the longest time to compute using Rack Mini Profiler
Below the report summary we can see all the SQL queries that were triggered for a selected request.
For each query, we can also see the traceback, which is super useful to have an idea about where to look in the codebase. We can also see timing and a great thing is that for the queries that are colored with red, the intensity is directly proportional to the amount of time required to solve the query.
One interesting thing to look for is queries that are repeated several times in the report. This is probably caused beacuse our code is performing a query inside an iteration. We should also take a look at queries that are taking a very long time to compute!
Repetitive Queries Problem
Lets take a look at one of the slowest queries I got:

Let's see what happens in cases_builder.rb:48:
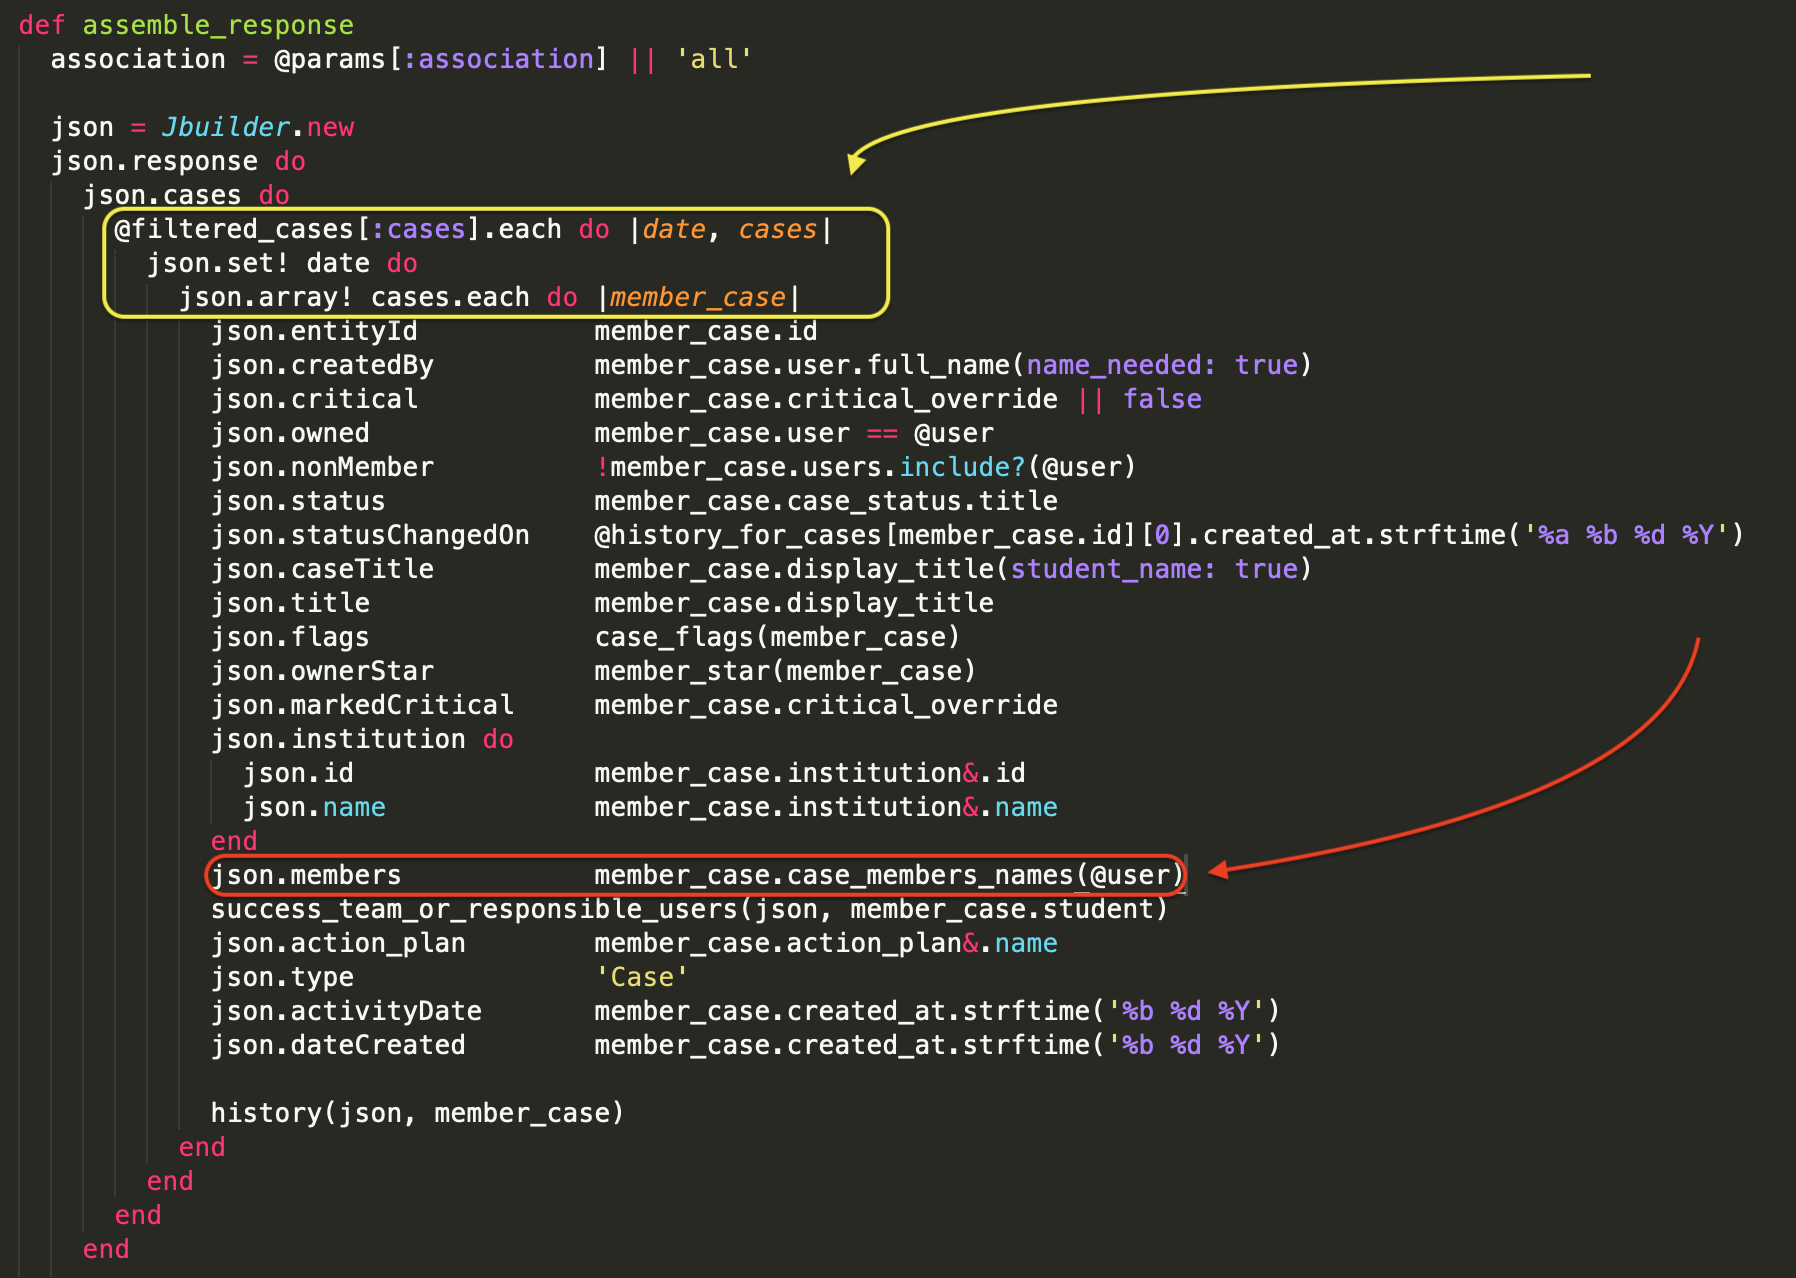
Here we can see that we are calling case_members_names from the Cases model, this call is being performed inside a loop and that can be a reason why I see the same query being performed a lot of times in the report, let's check what case_members_names does inside cases.rb:422:
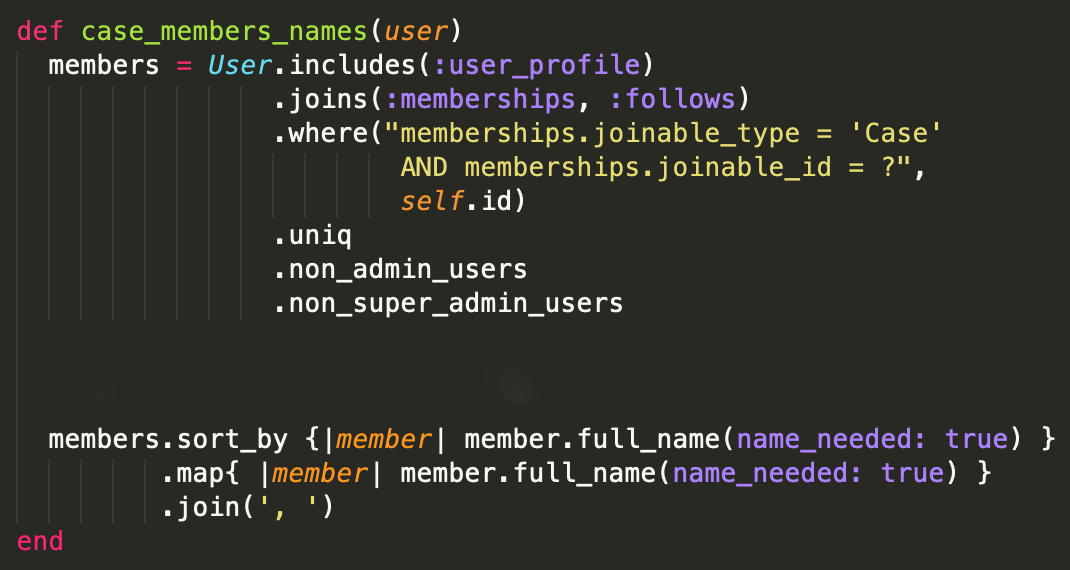
We can see here that the code is performing a query for each case of the loop, meaning, for each date, it iterates over all the cases and for each case, it performs a query (yellow arrow).
Fixing it
Fixing Repetitive Queries
To solve this particular problem, what we could do is grab all the cases' IDs and perform a single query to obtain all the members' names. To do this we can run a raw query (pure SQL query), we won't use the Active Record Query Interface
To solve the problem of performing the same query several times, one for each case, what we could do is grab all the cases' IDs and perform a single query to obtain all the members' names. One way of doing this is performing a raw query, like this:
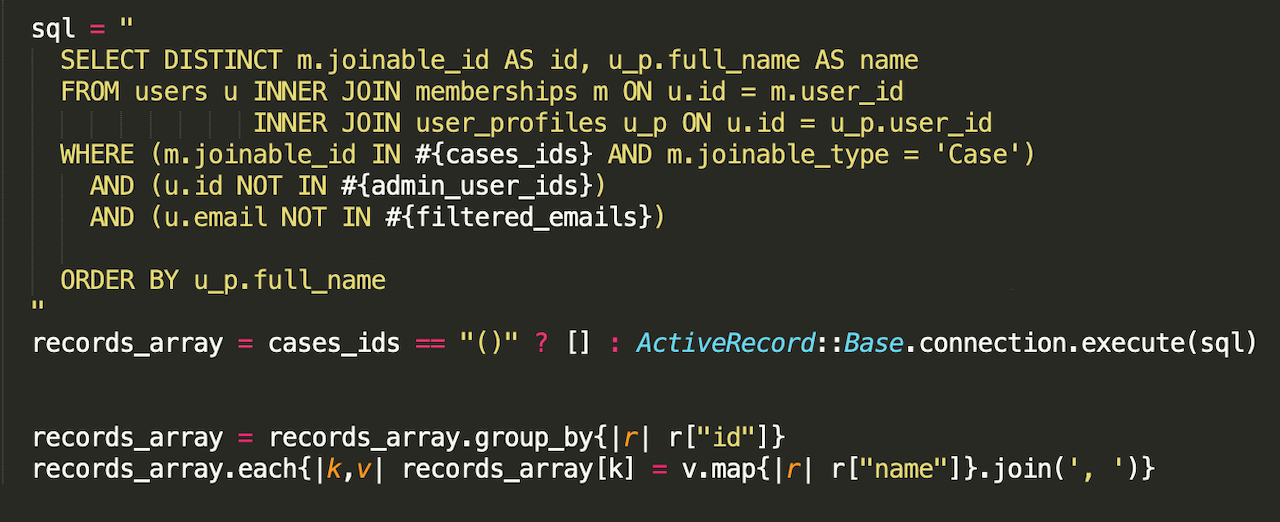
There are several ways of doing this.
Check the find_by_sql method.
Keep in mind that making queries using string interpolation can lead to an SQL injection, if you are sure that the interpolated strings are safe, then it's fine.
How can you know if a string is safe to interpolate?
If you know where the strings that you will be using are coming from, for example, if they are coming from your application's DB then they are probably safe to use (unless you are not making any kind of validation on what you are storing on your application's DB).
For the query in the image above, the IDs and emails are coming from the DB (IDs are automatically generated and the emails have validations therefore they are safe to use)
We should avoid performing queries inside iterations. There are always cases where a simple .includes(:entity) solves this problem. By calling .includes(:entity), rails performs what is called eager loading
I should also mention that eager loading isn't always the perfect solution because when we perform an eager load what is happening under the hood is that rails is instantiating all of the associated records in memory, this could lead to high memory usage if we are eager loading a large number of associated records or the associated records have many many fields.
So, for example, if we are eager loading associated records and these have hundreds of fields and we only need one of those fields, eager loading may not be the ideal solution because we would be loading into memory a lot of information that we aren't going to use.
More Problems • How to solve them
N+1
The N+1 query problem is one of the common performance antipatterns in ORMs. It happens when a query is executed on each result of the previous query, in other words, when an application gets data from the database and then loop through the result of that data.
Here is a great article that tells you all about this problem
find_each, use more queries or more memory?
We use .find_each to iterate through active records, this method is better for memory consumption because it does not bring all the records to memory at once, instead, it brings the records to memory in batches, the default batch size is 1000. The difference with calling .all.each is that .all brings all the records to memory performing a single query and .find_each performs many queries until there are no records to iterate through. There are cases where the query being performed to obtain the records is very expensive to compute, taking a long time to return the results, and we would want to perform a single query and have all the records in memory (using .all). In this case, we need to measure and decide whether to use more memory (using .all) or perform more queries (.find_each), sometimes choosing to use more memory and performing fewer queries results in quicker responses from the server, but, as always, it depends. In this case, it depends on the complexity of the query that retrieves the records that we are going to be iterating through.
More Fun Stuff
Analyzing queries at the SQL level
Once we've got rid of all the repetitive queries and our page is still performing poorly, we should start looking at the queries that take a long time to compute (we can use Rack Mini Profiler for that 😉) start tackling them one by one. To do that we need to analyze what is going on with specific queries.
We can open the rails console and use the .explain method on any AR query object.
This gives us information about what the query plan is and cost estimations. For Postgres DBs we can learn more about explain right here.
For Postgres, to get more accurate query plans/costs we can use EXPLAIN ANALYZE. The main difference with EXPLAIN is that this command actually executes the query. So we should be very careful about what kind of query we run with EXPLAIN ANALYZE. You could actually update/delete/create records, or even drop entire tables.
To learn more about EXPLAIN ANALYZE read here
To run these commands it's better if we use a database client, it can be psql, pgAdmin, or DataGrip. The last one is awesome 🙃 (you can get a free account with your college email address).
You could also run these commands from the rails console executing a RAW SQL query like we did in previous sections but it's not the best option.
Visualize your query plans!
If your query plans are too complex and/or too large to analyze in a terminal window we can start using a query plan visualizer like this one.
You need to format the query plan to JSON by adding (FORMAT JSON) but it is pretty straightforward to do.
With this tool, you can start to visualize each node and tackle the nodes one by one: a divide and conquer strategy ✨
Indexing (SQL)
Creating the correct indexes in our databases is a must when it comes to DB performance. Indexes are data structures that are used to perform operations in a more efficient and intelligently way.
Indexes can be created to make specific queries perform faster in a very quick way since it doesn’t require a DB redesign or a more complex solution.
For creating indexes we need to have a basic understanding of how the RDBMS process our queries and how it actually solves them. here is a good article that covers the basics of indexes
Views / Materialized Views
These are great tools for solving specific problems that you may face when working on some solutions. The basic idea of a database view is that is a stored query, you can query a view as if it was a table but what is going on internally is that the RDBMS is running the stored query that defined the view, if the query isn't well optimized (for example we don't have the correct indexes) the times it takes to return the result can take a very long time, but, as always it depends on many different factors.
A database materialized view is also a stored query but the difference with the normal database view is that the results of a materialized view are actually stored in disk (is a form of caching) when we create or refresh the material. This gives us performance benefits since the results aren't being calculated on the fly (dynamically) like it happens when we use a normal view. One thing to notice is that the data we have for a materialized view is not changed until we run the refresh command. We shouldn't be using a materialized view for retrieving data that change very frequently because to get the most up-to-date data we should be refreshing quite frequently.
Learn a bit more: